Welcome to the Training Data Viewer section. This section goes over how to use the Training Data Viewer to look at the training data that is used for training a machine learning model.
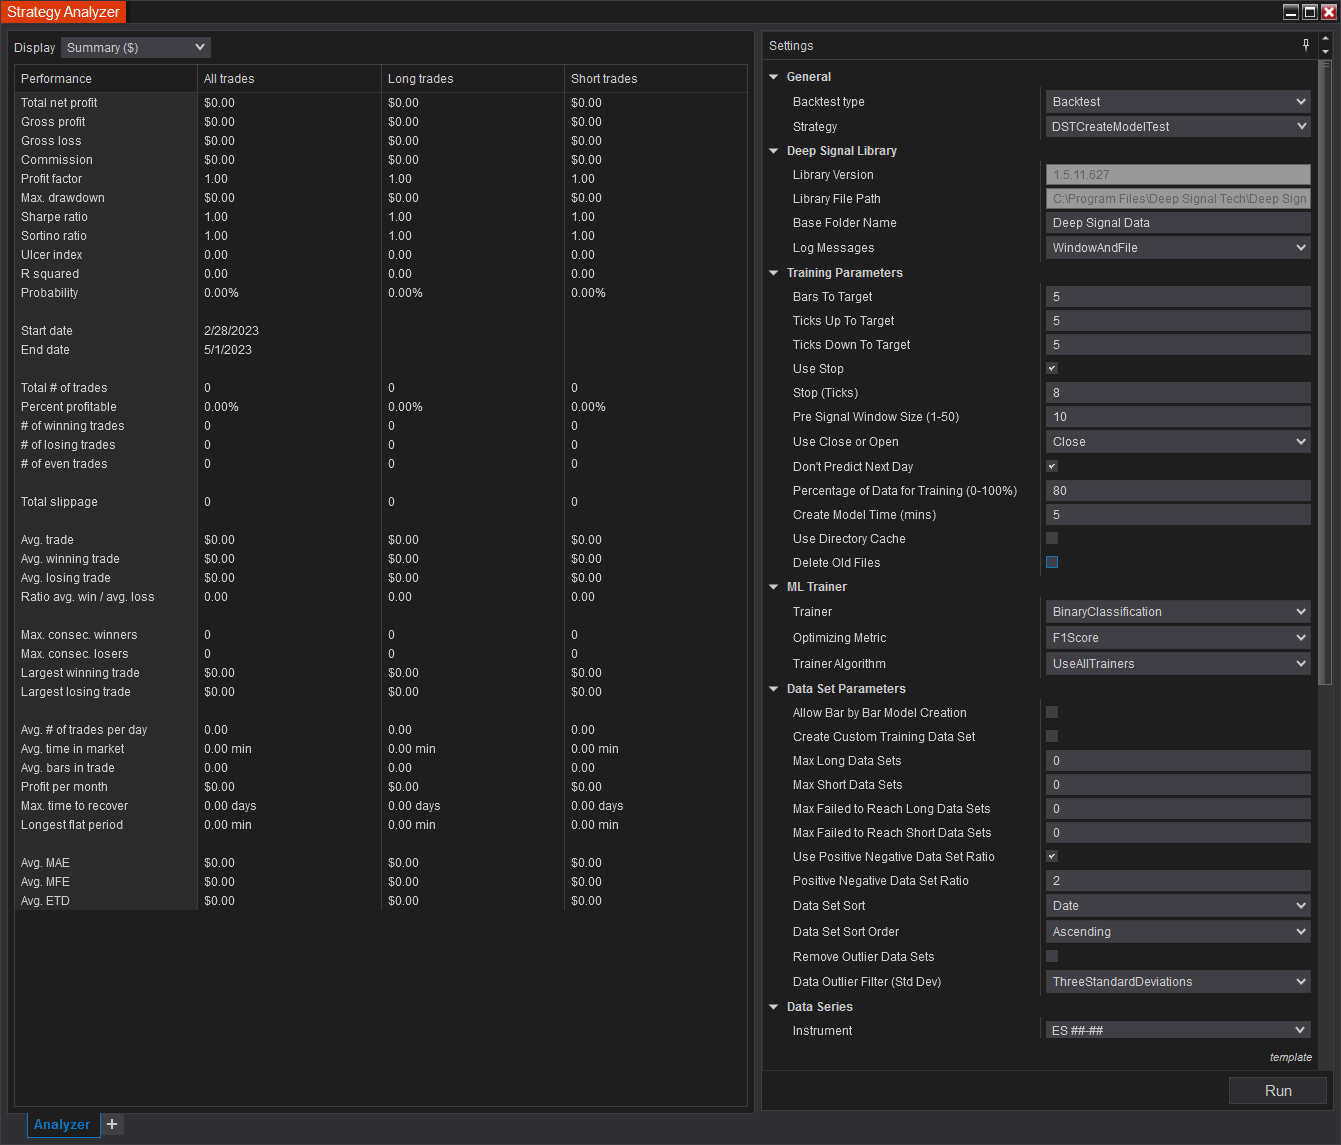
In order to use the Training Data Viewer, the Delete Old Files parameter needs to be unchecked when creating a new model, otherwise the library will automatically delete the data file needed to display the training data.
If the Delete Old Files parameter is unchecked then there will be additional files that are not deleted after creating a new machine learning model. Here is what the Windows Explorer file list may look like after creating a model.
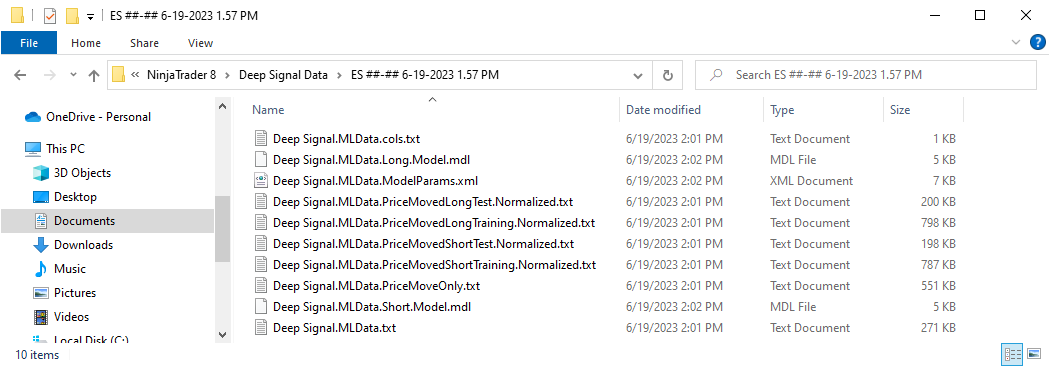
There should be a Deep Signal.MLData.PriceMoveOnly.txt file that is created in the data folder that contains the machine learning training data and models.
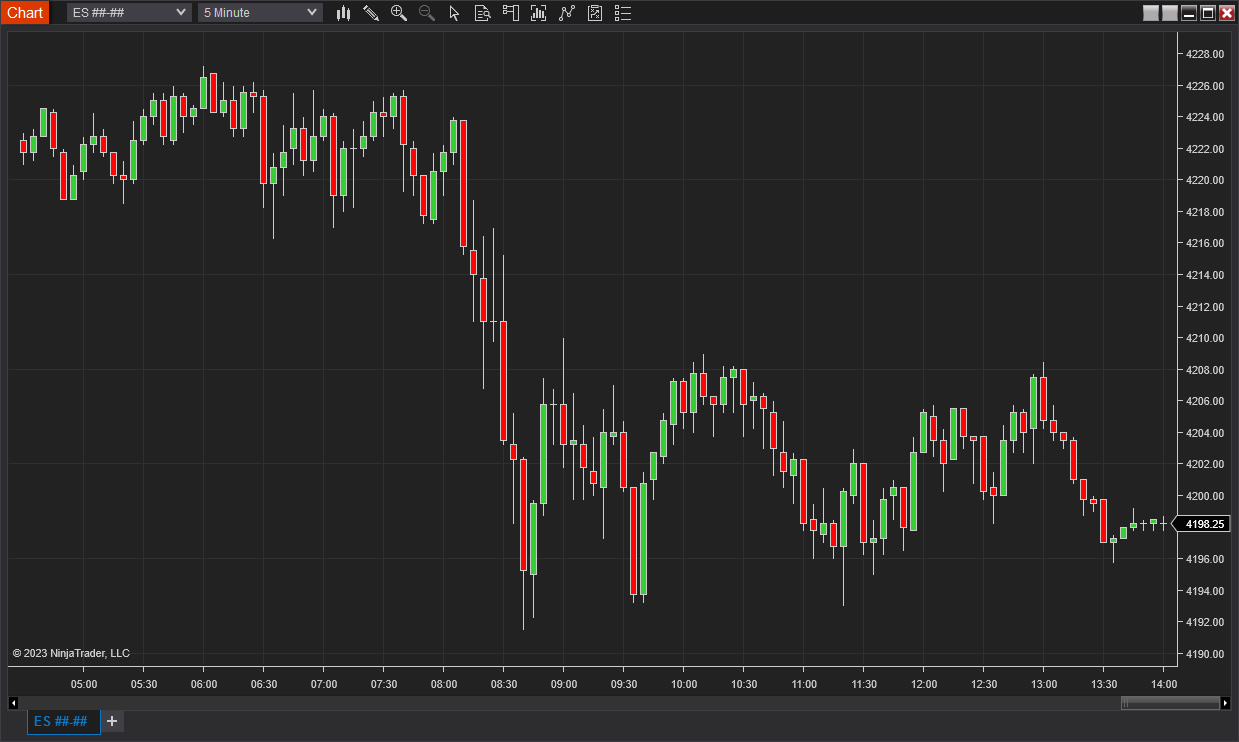
In order to view the training data, we need to open a new chart window (NinjaTrader -> New -> Chart) with the same instrument and bar type that was used to create the model.
Once the new chart is open, we can either click on the Indicators button at the top of the chart or right click on the chart to bring up the menu and select Indicators.
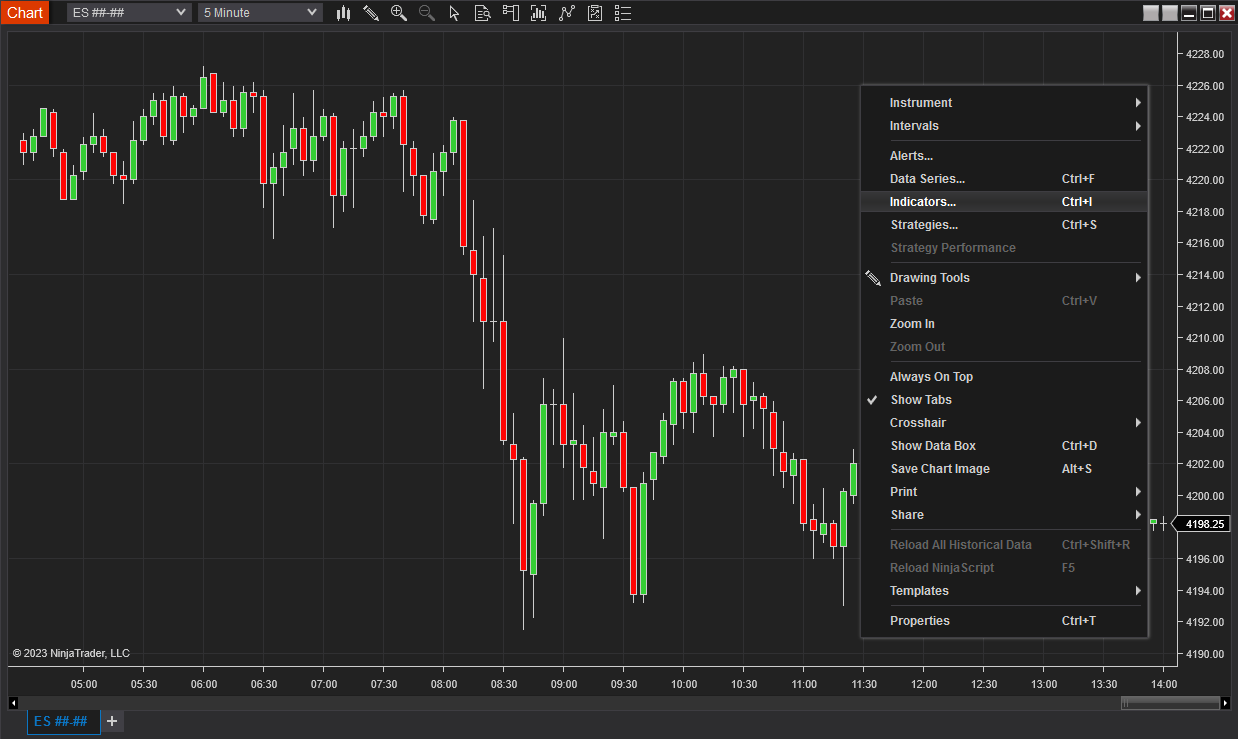
In the list of indicators select the DSTTrainingDataViewer indicator and click on Add. In the Price Move Data Folder, select the data folder from the drop down list of folders for the training data that will be displayed on the chart then click on OK. Please do not select the DSTTrainingDataViewerBase as this is the base indicator file used for drawing.
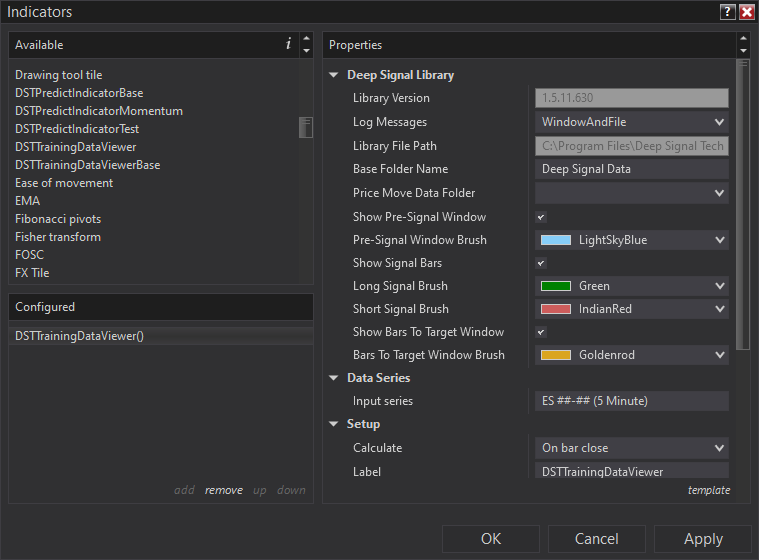
The Deep Signal Library will display the Pre-Signal Window, Long/Short Signal Bars and the Bars to Target window data that the library uses to create a new model.
The colors can be customized but the defaults are LightSkyBlue for the Pre-Signal Window, Green for the Long Signal Bar, Indian Red for the Short Signal Bar and Goldenrod for the Bars To Target Window.
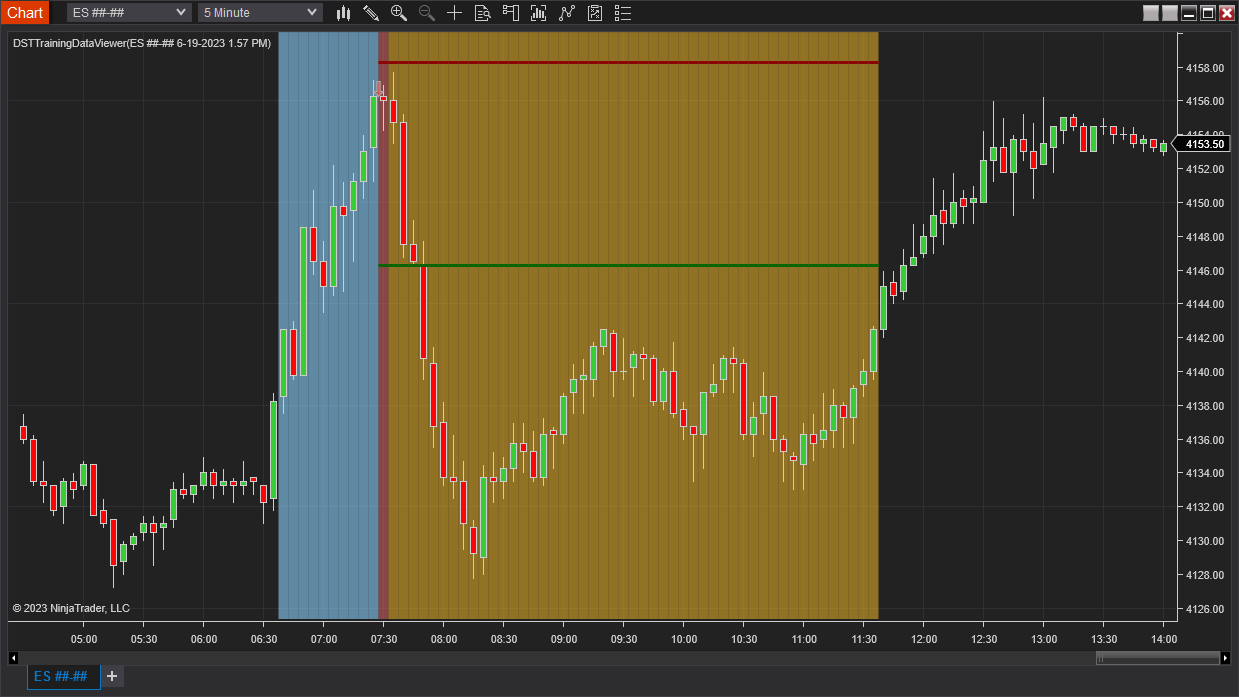
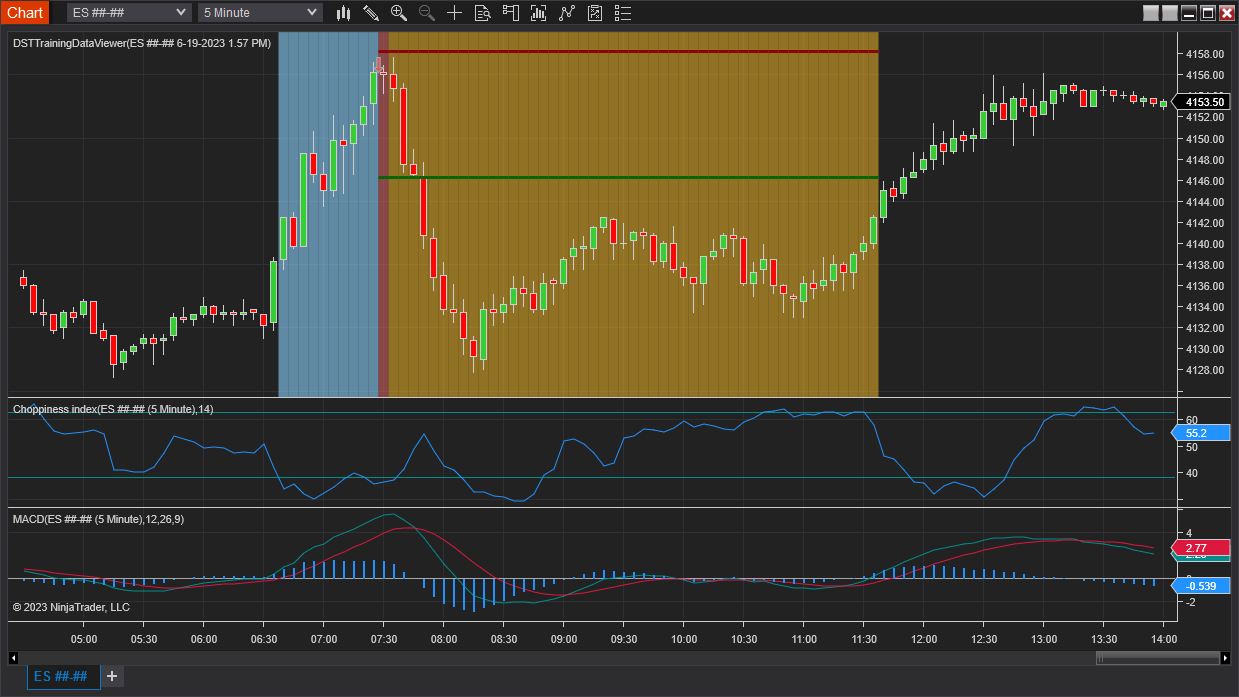
In the example below, this is for a 5 minute chart with ES ##-## where the Pre-Signal Window is 10 bars starting at 6:40. The Short Signal Bar is at 7:30 and this would signify where we would want to enter a trade using the training data. Please note that the Signal Bar is actually the first bar of the Bars to Target window. The Bars To Target window for this example is set to 50 bars.
The horizontal red line in the Bars To Target window is the Stop price and the green line is the Profit Target price based on the entry price for the data set. Please note for a short trade entry the stop price will be above the entry price and for long entries the stop price will be below the entry price.
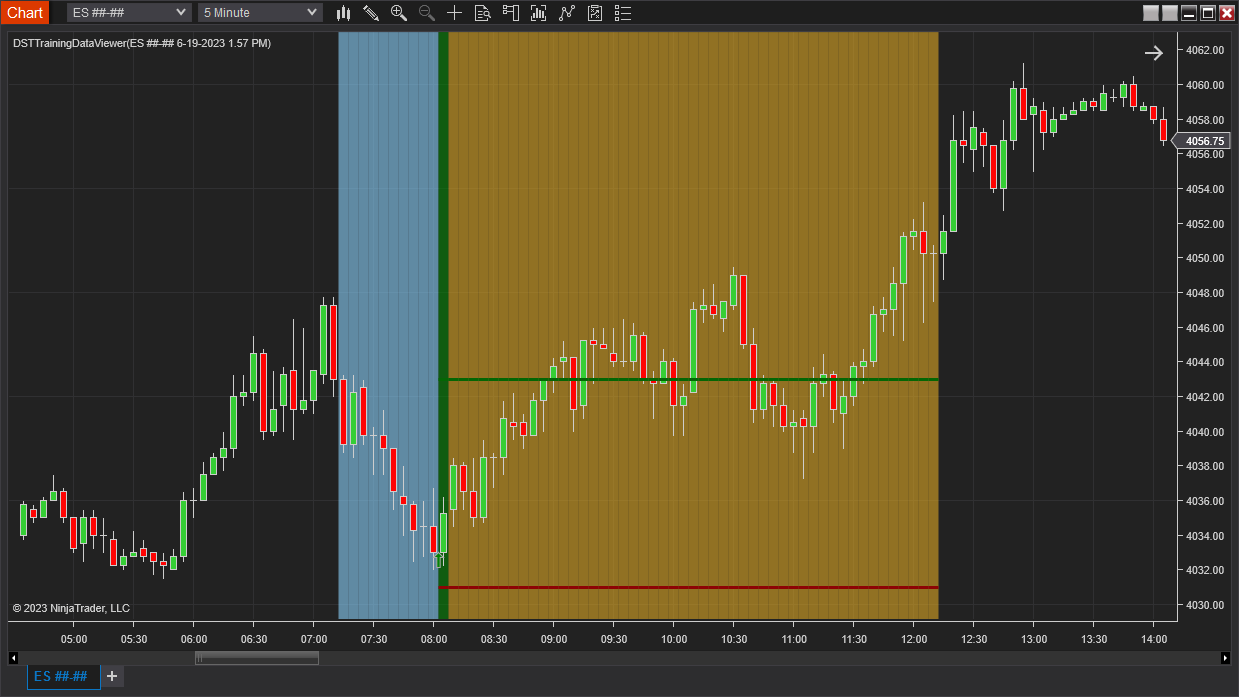
Here is another example with a long trade entry.
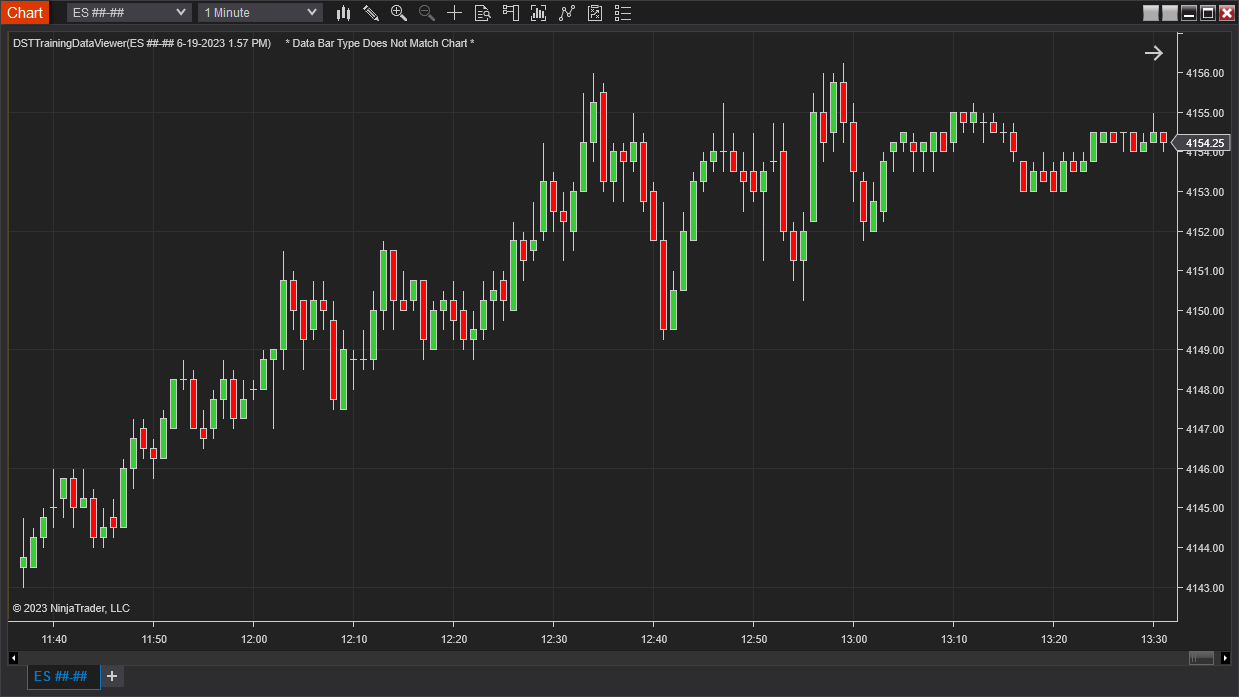
If the wrong bar type is used, then the message Data Bar Type Does Not Match Chart will be displayed in the upper left side of the chart. Once the correct bar type is selected the message will go away.
The data viewer functionality can help the trader visualize what data is going to be used in creating a new machine learning model. As an example, additional indicators can be added to the chart to help correlate the data used in the model to indicator data. The example below adds the Choppiness index and MACD indicators to our chart.
The DSTTrainingDataViewer file can be modified by the user to add additional functionality, but please do not modify the DSTTrainingDataViewerBase file as the DSTTrainingDataViewer file depends on the base file.
Futures, foreign currency and options trading contains substantial risk and is not for every investor. An investor could potentially lose all or more than the initial investment. Risk capital is money that can be lost without jeopardizing ones financial security or lifestyle. Only risk capital should be used for trading and only those with sufficient risk capital should consider trading. Past performance is not necessarily indicative of future results.