Cluster Statistics
What It Shows
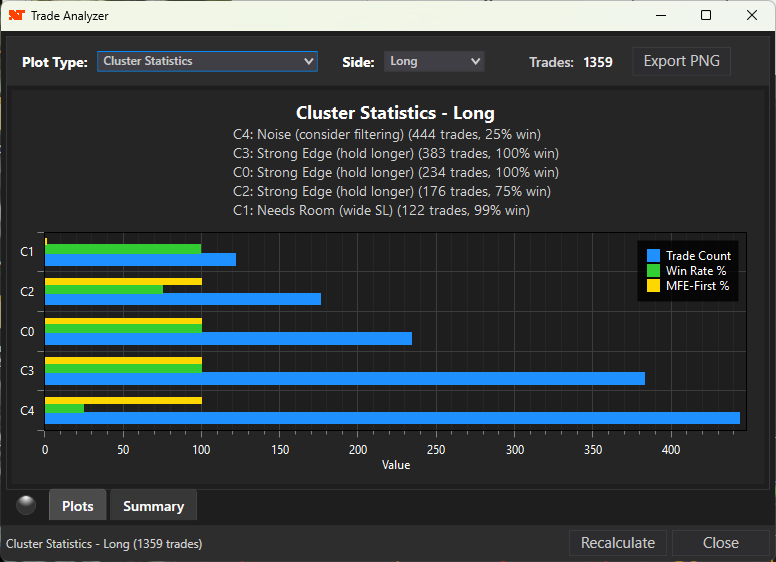
A bar chart comparing key metrics across all clusters:
• Blue bars: Trade count per cluster
• Green bars: Win rate percentage
• Gold bars: MFE-First rate (percentage of trades where profit came before drawdown)
The subtitle lists each cluster's archetype classification.
How to Read It
Compare Metrics Across Clusters:
• High trade count + high win rate: Core profitable signal
• Low trade count + very high win rate: Rare but excellent - find more
• High trade count + low win rate: Volume trades dragging performance
• High MFE-First rate: Good for trailing stops
• Low MFE-First rate: Needs room to work - use wider stops
How to Use This to Improve Trading
1. Identify Your Best Cluster:
Find the cluster with the highest combination of:
• Reasonable trade count (enough to be significant)
• High win rate
• Favorable MFE-First rate
Focus your analysis on what makes these trades special.
2. Calculate Weighted Performance:
A cluster with 200 trades at 55% win rate contributes more to your P&L than a cluster with 10 trades at 80% win rate. Consider both quality and quantity.
3. Choose Management Style by MFE-First Rate:
• >60% MFE-First: Trailing stops work well
• <40% MFE-First: Need patience and wider stops
• ~50% MFE-First: Either approach can work
4. Set Cluster-Specific Targets:
Different clusters may need different TP/SL settings. Use the EV heatmap for each cluster type separately (if possible) to optimize settings per cluster.
Futures, foreign currency and options trading contains substantial risk and is not for every investor. An investor could potentially lose all or more than the initial investment. Risk capital is money that can be lost without jeopardizing ones financial security or lifestyle. Only risk capital should be used for trading and only those with sufficient risk capital should consider trading. Past performance is not necessarily indicative of future results.