MFE vs MAE Scatter Plot
What It Shows
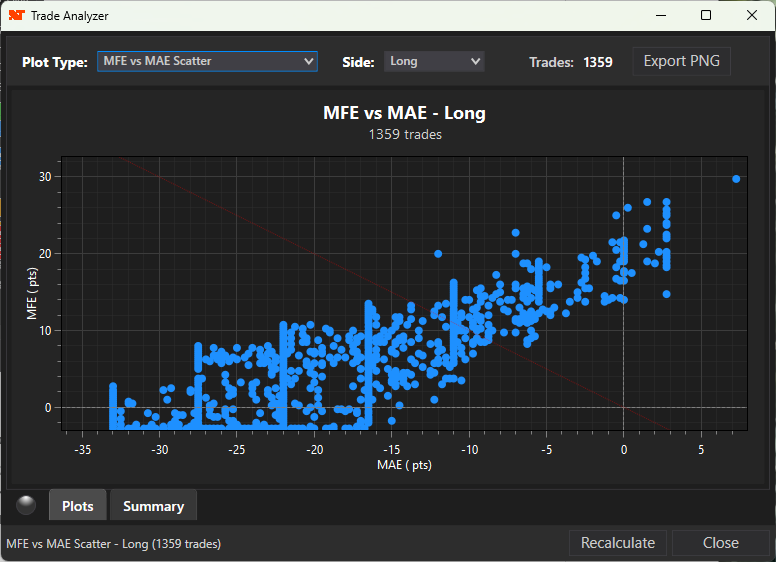
This is the foundational visualization that plots every trade as a point on a two-dimensional grid:
• X-axis (horizontal): MAE (Maximum Adverse Excursion) - how far price moved against you
• Y-axis (vertical): MFE (Maximum Favorable Excursion) - how far price moved in your favor
Each dot represents one trade. The plot includes:
• A horizontal zero line - trades above this had positive MFE
• A vertical zero line - trades left of this had negative MAE (drawdown)
• A diagonal break-even line (red dotted) - where MFE equals the absolute value of MAE
How to Read It
Quadrant Analysis:
Location |
Meaning |
|
Upper-left quadrant |
IDEAL - High MFE, low MAE. Price moved in your favor without significant drawdown |
|
Upper-right quadrant |
RARE - Both positive MFE and positive MAE (unusual, check data) |
|
Lower-left quadrant |
POOR - Low MFE, high drawdown. Trade went against you and never recovered well |
|
Lower-right quadrant |
RARE - Negative MFE with positive MAE (check data) |
Point Cloud Shape:
• Tight cluster: Consistent trade behavior - easier to set fixed TP/SL
• Wide scatter: Variable trade outcomes - may need adaptive management
• Diagonal elongation: MFE and MAE are correlated - bigger wins come with bigger drawdowns
• Horizontal spread: Variable drawdowns but consistent profits
• Vertical spread: Variable profits but consistent drawdowns
How to Use This to Improve Trading
1. Stop-Loss Sizing:
Look at the leftmost extent of your point cloud. This tells you how much "room" your trades typically need. If most points are clustered around MAE = -2 points but a few reach -5 points, you know:
• A 2-point stop will get hit frequently even on winning trades
• A 5-point stop would survive most normal adverse moves
• The optimal stop is probably between these values
2. Take-Profit Targeting:
Look at the vertical distribution. If most trades cluster around MFE = 3 points but a few reach 8 points:
• A 3-point target is achievable on most trades
• An 8-point target would rarely be hit
• Consider a 2.5-point target for high probability, or use a trailing stop to capture outlier moves
3. Identifying Problem Trades:
Points in the lower-left (high MAE, low MFE) represent your worst trades. Ask yourself:
• What market conditions produced these?
• Can you filter these signals?
• Are there common characteristics?
4. Risk/Reward Assessment:
The diagonal break-even line shows where MFE = |MAE|. Points above this line represent trades where potential profit exceeded potential loss. If most points are below the line, your signal has unfavorable risk/reward geometry and needs filtering or different management.
Futures, foreign currency and options trading contains substantial risk and is not for every investor. An investor could potentially lose all or more than the initial investment. Risk capital is money that can be lost without jeopardizing ones financial security or lifestyle. Only risk capital should be used for trading and only those with sufficient risk capital should consider trading. Past performance is not necessarily indicative of future results.