MFE/MAE Distributions
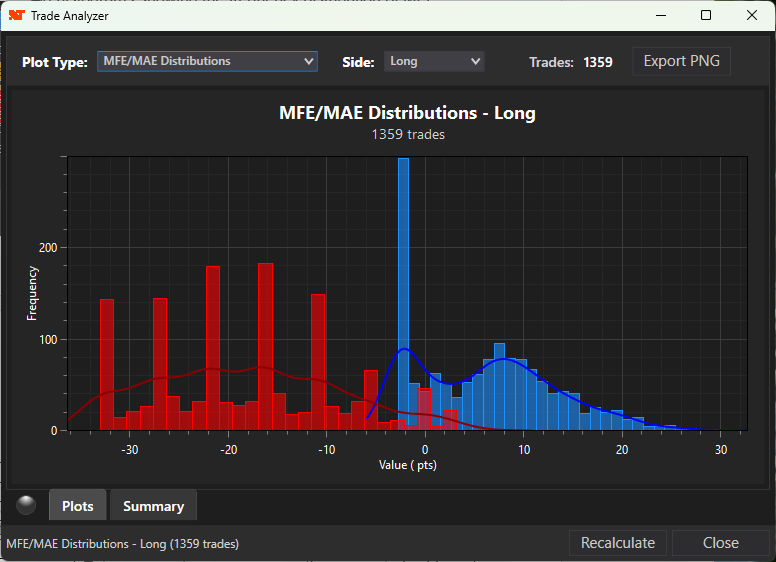
What It Shows
This plot displays overlapping histograms showing the frequency distribution of MFE and MAE values separately:
• Blue bars/curve: Distribution of MFE values
• Red bars/curve: Distribution of MAE values
• Smooth curves: Kernel Density Estimation (KDE) showing the underlying probability distribution
How to Read It
Distribution Shapes:
Shape |
Interpretation |
|
Normal (bell curve) |
Predictable behavior; fixed TP/SL works well |
|
Right-skewed (tail to right) |
Occasional large winners; consider trailing stops |
|
Left-skewed (tail to left) |
Occasional large losers; need protection from outliers |
|
Bimodal (two peaks) |
Two distinct trade types; consider separate strategies |
|
Fat tails |
Extreme events more common than expected; widen stops |
Overlap Analysis:
• No overlap (MFE all positive, MAE all negative): Clean signal with clear direction
• Heavy overlap near zero: Signal produces small, uncertain moves
• MFE distribution wider than MAE: Winners vary more than losers
• MAE distribution wider than MFE: Losers vary more than winners (dangerous)
How to Use This to Improve Trading
1. Set Probability-Based Targets:
Find where the MFE distribution has significant mass. The median (50th percentile) tells you what profit is achievable half the time. Setting your target near this value maximizes trade completion rate.
2. Set Probability-Based Stops:
The MAE distribution's left tail shows your worst-case scenarios. Set stops based on percentiles:
• 10th percentile: Stop would survive 90% of trades
• 5th percentile: Stop would survive 95% of trades
• 1st percentile: Protection from almost all adverse moves
3. Detect Regime Changes:
If distributions have multiple peaks, your signal behaves differently in different market conditions. Consider:
• Time-of-day filters
• Volatility filters
• Trend/range filters
4. Assess Edge Consistency:
A narrow, positive MFE distribution means consistent small wins. A wide MFE distribution means variable outcomes. Match your position sizing to this variability.
Futures, foreign currency and options trading contains substantial risk and is not for every investor. An investor could potentially lose all or more than the initial investment. Risk capital is money that can be lost without jeopardizing ones financial security or lifestyle. Only risk capital should be used for trading and only those with sufficient risk capital should consider trading. Past performance is not necessarily indicative of future results.