Deep Signal Limit Order Book Imbalance – Parameters
This section describes each configurable parameter for the LOB Imbalance indicator and how it affects behavior, responsiveness, and visualization.
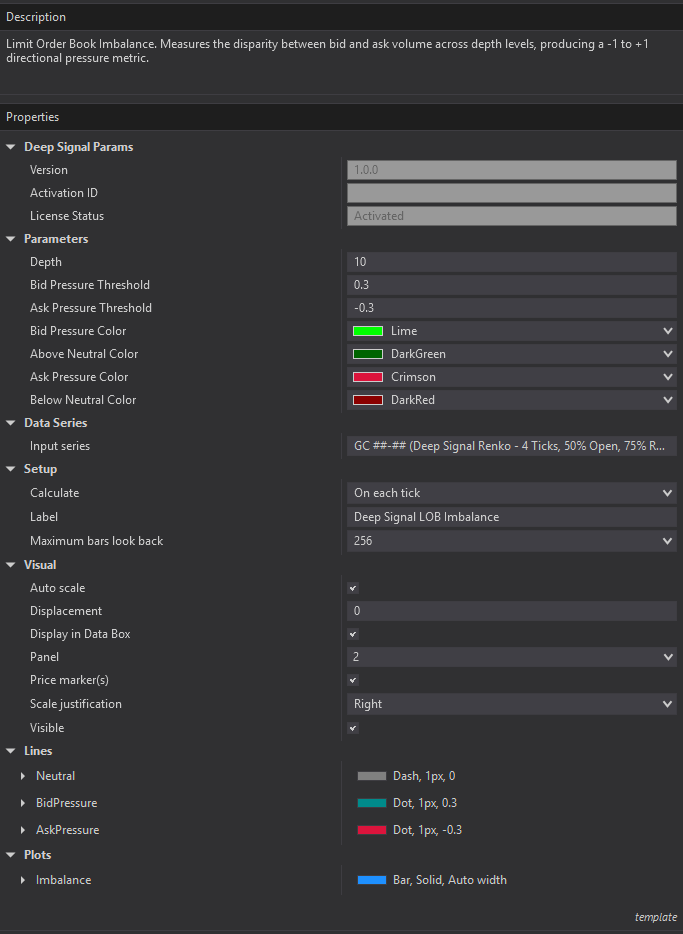
Here is the Properties dialog that contains the LOB Imbalance parameters.
Overview
Deep Signal LOB Imbalance is a market microstructure indicator that measures the imbalance between bid and ask volume across order book depth.
It produces a normalized value between -1 and +1:
- Above 0.3 → Strong bid-side dominance (buying pressure)
- Below -0.3 → Strong ask-side dominance (selling pressure)
- 0 → Balanced order book (neutral pressure)
This allows traders to quickly identify whether price movement is supported by real liquidity or if the market is becoming imbalanced and directional.
How It Works
The indicator aggregates volume across multiple levels of the order book and computes:
- Relative strength of bid vs ask liquidity
- Directional pressure using a normalized imbalance metric
- Visual signals using color-coded bars and thresholds
Parameters
Depth
Default: 10
Description:
Defines how many levels of the order book are included in the imbalance calculation.
Usage:
- Lower values (e.g., 5–10): Focus on near-price liquidity (scalping)
- Higher values (e.g., 15–30): Capture broader market pressure (swing context)
Bid Pressure Threshold
Default: 0.3
Description: Specifies the minimum imbalance value required to classify strong bid-side pressure.
Behavior:
- When imbalance ≥ threshold → considered meaningful buying pressure
- Controls when bars shift into high-confidence bullish territory
Ask Pressure Threshold
Default: -0.3
Description: Specifies the minimum imbalance value required to classify strong ask-side pressure.
Behavior:
- When imbalance ≤ threshold → considered meaningful selling pressure
- Controls when bars shift into high-confidence bearish territory
Bid Pressure Color
Default: Lime
Description: Color used when imbalance exceeds the Bid Pressure Threshold.
Interpretation:
- Represents strong buying pressure
- Indicates dominant bid liquidity supporting price
Above Neutral Color
Default: Dark Green
Description: Color used when imbalance is:
- Greater than 0
- But below the Bid Pressure Threshold
Interpretation:
- Mild bullish bias
- Buyers are present, but not dominant
Ask Pressure Color
Default: Crimson
Description: Color used when imbalance exceeds the Ask Pressure Threshold (negative side).
Interpretation:
- Represents strong selling pressure
- Indicates dominant ask liquidity
Below Neutral Color
Default: Dark Red
Description: Color used when imbalance is:
- Less than 0
- But above the Ask Pressure Threshold
Interpretation:
- Mild bearish bias
- Sellers are present, but not aggressive
Visual Elements
Imbalance Plot
Displays the imbalance value as a histogram:
- Positive values → Bid dominance
- Negative values → Ask dominance
- Color changes reflect pressure intensity
Neutral Line (0)
A reference line indicating balanced order flow.
Bid Pressure Line
Horizontal line at the Bid Pressure Threshold:
- Marks transition into strong bullish pressure
Ask Pressure Line
Horizontal line at the Ask Pressure Threshold:
- Marks transition into strong bearish pressure
Interpretation Guide
Strong Buy Pressure (Bright Green / Lime)
- Imbalance ≥ Bid Threshold
- Market shows aggressive bid support
- Often precedes or confirms upward moves
Moderate Buy Pressure (Dark Green)
- Imbalance between 0 and Bid Threshold
- Buyers present, but not dominant
- Can indicate early accumulation
Neutral Zone (Around 0)
- Balanced order book
- Low directional conviction
- Expect chop or consolidation
Moderate Sell Pressure (Dark Red)
- Imbalance between 0 and Ask Threshold
- Sellers present but not aggressive
- Potential early distribution phase
Strong Sell Pressure (Crimson)
- Imbalance ≤ Ask Threshold
- Strong ask-side dominance
- Often precedes or confirms downward moves
Best Practices
Scalping
- Use lower Depth (5–10)
- Focus on quick transitions between thresholds
- Combine with fast charts (tick or Renko)
Intraday / Trend Trading
- Use moderate Depth (10–20)
- Watch for sustained imbalance trends
- Align with price structure
Confirmation Tool
LOB Imbalance works best when used with:
- Price action (structure / breakouts)
- Deep Signal Renko
- Order flow or volume-based indicators
Key Insight
LOB Imbalance helps answer a critical question:
👉 “Is price movement backed by real liquidity—or just noise?”
When imbalance aligns with price direction, moves tend to be stronger, cleaner, and more reliable.
Futures, foreign currency and options trading contains substantial risk and is not for every investor. An investor could potentially lose all or more than the initial investment. Risk capital is money that can be lost without jeopardizing ones financial security or lifestyle. Only risk capital should be used for trading and only those with sufficient risk capital should consider trading. Past performance is not necessarily indicative of future results.