Deep Signal OT Ratio (Order-to-Trade Ratio)
Overview
The Deep Signal Order-to-Trade Ratio (OTR) is a high-frequency microstructure indicator that measures the volume of order-book activity relative to the number of executed trades. It quantifies how many order events — additions, modifications, and cancellations — occur for every trade that actually fills.
OTR is a regulatory metric widely used to detect potentially manipulative order-book behaviour such as layering and spoofing, where large numbers of orders are placed and quickly cancelled to create a false impression of liquidity without any intention of executing. A high OTR indicates that the majority of order activity is non-executable and may signal either very low liquidity, aggressive HFT strategies, or deliberate manipulation.
Unlike a single combined OTR, this indicator splits the measurement into bid-side and ask-side components. Bid activity is plotted above zero using green shades; ask activity is plotted below zero using red shades. This diverging histogram makes it immediately visible whether order-book pressure is concentrated on one side of the market.
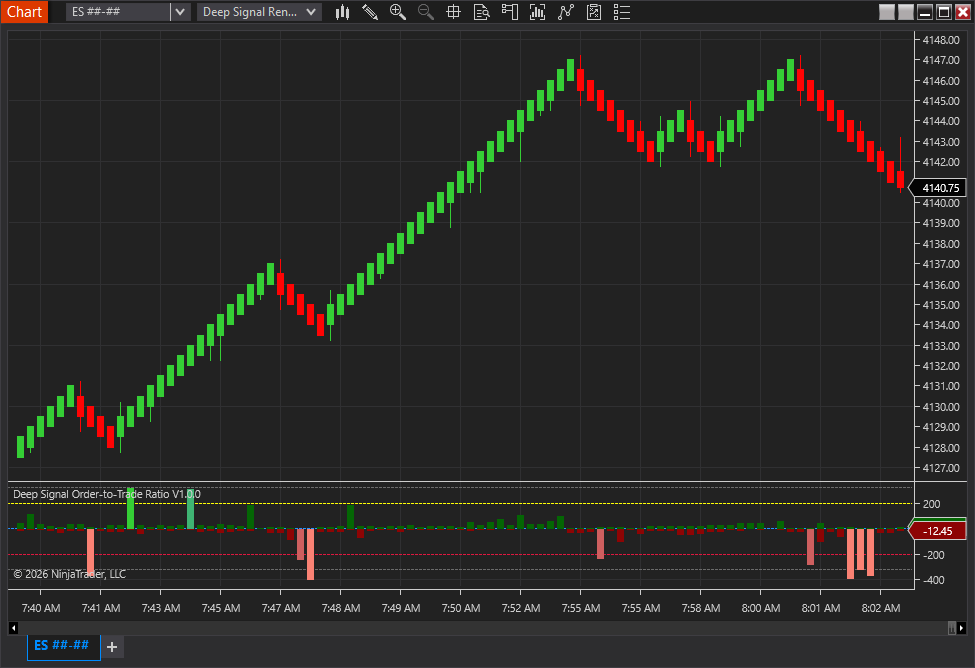
* Please note the elevated threshold was changed to 200 and the high threshold was changed to 320 for this chart
Key Features
- Real-Time Order Flow Transparency
Reveals hidden activity inside the order book beyond price movement. - Regulatory-Grade Metric
Based on industry-standard methods used to monitor spoofing and layering. - Weighted Order Activity Model
Applies higher importance to updates, reflecting their true market impact. - Rolling Window Calculation
Continuously adapts to current market conditions using a configurable aggregation period. - Market Quality Indicator
Distinguishes between efficient participation and excessive noise. - Spoofing & Manipulation Detection
Identifies abnormal order churn relative to executed trades. - Complements Microstructure Tools
Works alongside indicators like Resilience Index, LOB Imbalance, and VPIN.
Output
|
Plot |
Direction |
Default Colors |
Description |
|
Bid OTR |
Positive (above zero) |
Dark Green → Medium Sea Green → Lime Green |
Order-to-trade ratio for the bid side of the book. Higher values indicate heavier bid-side order churn relative to trades. |
|
Ask OTR |
Negative (below zero) |
Dark Red → Indian Red → Salmon |
Order-to-trade ratio for the ask side of the book, negated for display. The magnitude below zero reflects the same scale as the bid bars above zero. |
Both plots are bar-style and start at zero each aggregation window.
Formula
Per-side OTR: OTR(side) = ( Adds(side) + 2 × Updates(side) + Deletes(side) ) / max( Trades(side), 1 ) − 1
Key Details
- Adds: New limit orders entering the book
- Updates: Modifications to existing orders (weighted ×2)
- Deletes: Order cancellations/removals
- Trades: Executed transactions
Why Updates Are Weighted ×2:
- Each update is effectively a cancel + new order, so it carries double impact.
Normalization:
- The −1 adjustment ensures:
- A perfectly efficient market → OTR = 0
How It Works
Trade Side Classification
When a trade prints, the indicator uses the order-book side convention to decide which counter to increment:
- Buy aggressor (lifts the ask) — the ask side of the book is depleted. The trade increments Trades(Ask).
- Sell aggressor (hits the bid) — the bid side of the book is depleted. The trade increments Trades(Bid).
Classification is determined by comparing the trade price to the current best bid and ask: a print at or above the ask is a buy aggressor; a print at or below the bid is a sell aggressor. Trades printing between the spread are not classified to either side.
Aggregation Window
All counters accumulate from the first market event received. When the elapsed time since the window opened reaches or exceeds Aggregation Period (ms), the OTR values are published and all counters are reset to zero. The window then starts fresh on the next event. Shorter windows react faster; longer windows smooth out microstructure noise.
Depth Event Routing
Each market depth event carries a side indicator (Bid or Ask). Add, Update, and Remove operations are routed into the corresponding bid or ask counter set. Both sides are processed on every tick.
Interpretation Guidelines
|
OTR Magnitude |
Interpretation |
|
≈ 0 |
Balanced. Order activity is proportionate to executed trades. Normal, liquid market conditions. |
|
Above Elevated Threshold (default 5) |
Elevated churn. Significantly more order events than trades. May indicate aggressive HFT quoting, thin liquidity, or early-stage spoofing behaviour. |
|
Above High Threshold (default 20) |
Very high. A large number of orders are being placed and cancelled for every executed trade. Potential spoofing, layering, or an extremely illiquid market. Exercise caution with entries. |
Bid vs Ask Imbalance
When the bid bars are substantially taller than the ask bars, the bid side is experiencing disproportionately high non-executed order activity. This can indicate spoof bids being placed to push price upward before being cancelled, aggressive market-maker bid refreshing, or genuine buying interest against limited ask liquidity.
The reverse applies when ask bars dominate. Persistent imbalance in one direction over multiple aggregation windows is a stronger signal than a single spike.
Practical Trading Applications
1. Market Quality Assessment
OTR helps determine whether the market is:
- Efficient (low OTR) → reliable execution
- Noisy (high OTR) → unreliable liquidity
2. Spoofing / Manipulation Detection
High OTR signals:
- Excessive order placement without execution
- Potential fake liquidity
3. Trade Filtering
Use OTR to filter trades:
- Favor entries during low OTR environments
- Avoid signals when OTR is elevated
4. Slippage Awareness
Higher OTR = higher risk of:
- Sudden liquidity withdrawal
- Poor fills
- Larger price impact
5. Combined Microstructure Analysis
OTR becomes more powerful when paired with:
- LOB Imbalance:
- Confirms whether pressure is real or artificial
- VPIN:
- Adds volume toxicity context
Warmup Requirements
- Requires sufficient order flow activity to stabilize counts
- During startup:
- OTR may appear volatile or inconsistent
- Stabilizes after several aggregation cycles
Requirements & Notes
- Level 2 data is required (OnMarketDepth)
- Trade data required (OnMarketData)
- Uses real-time event streams, not aggregated bars
- Behavior is consistent across live and replay environments
Summary
The Deep Signal OTR indicator provides a real-time split view of order-book activity efficiency on both the bid and ask sides. By normalising order events against actual trades and displaying the result as a diverging histogram, traders can quickly assess whether one side of the market is experiencing abnormally high non-executed order flow — a potential leading indicator of price impact, manipulation, or a shift in short-term liquidity conditions.
Used alongside other microstructure tools such as LOB Imbalance or VPIN, the OTR indicator forms part of a comprehensive high-frequency market analysis suite.
In short:
OTR tells you whether orders matter—or if they’re just noise.
Futures, foreign currency and options trading contains substantial risk and is not for every investor. An investor could potentially lose all or more than the initial investment. Risk capital is money that can be lost without jeopardizing ones financial security or lifestyle. Only risk capital should be used for trading and only those with sufficient risk capital should consider trading. Past performance is not necessarily indicative of future results.