Deep Signal Cobra – Parameters
This section describes each configurable parameter for the Deep Signal Cobra indicator and how it affects behavior, responsiveness, and visualization.
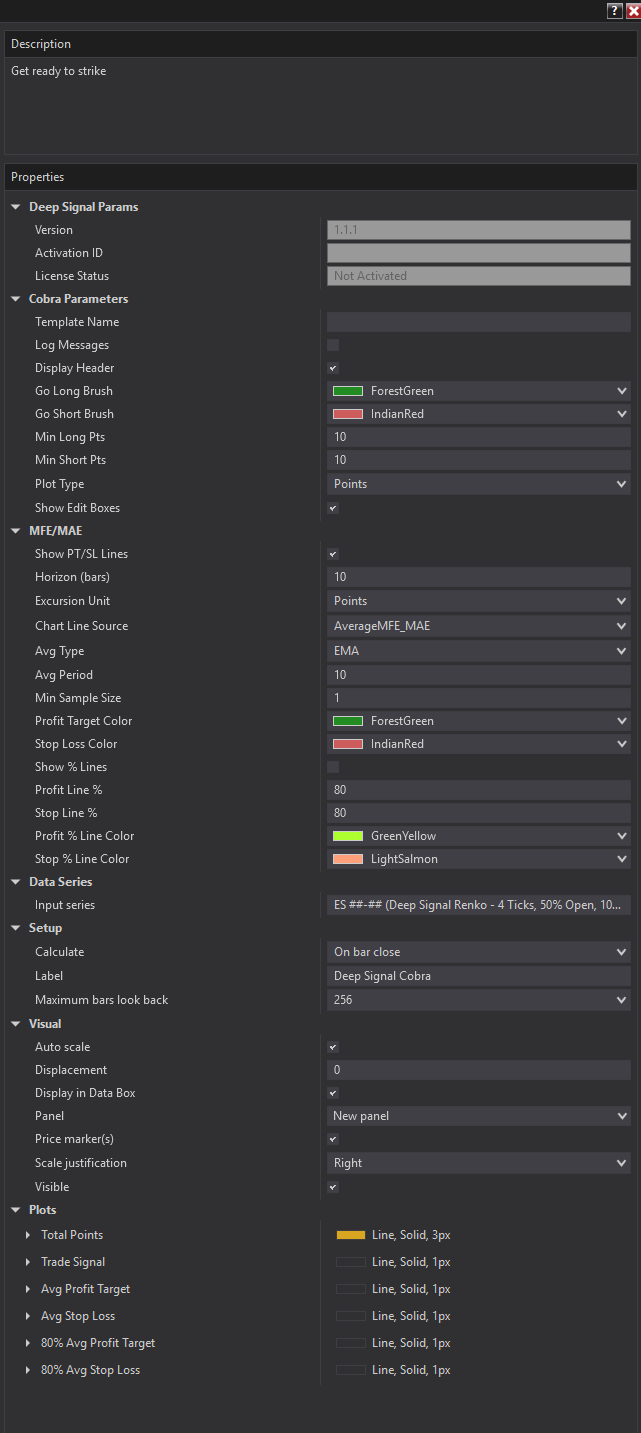
Here is the Properties dialog that contains the Deep Signal Cobra parameters.
Overview
Deep Signal Cobra identifies high-probability long and short trade setups by scoring price action through a multi-factor analysis engine. It also includes a built-in MFE/MAE engine that tracks how far the market moved in your favor (Maximum Favorable Excursion) and against you (Maximum Adverse Excursion) after each signal, and draws historical profit target and stop loss reference lines directly on the price panel.
Parameters
Cobra Parameters
Template Name The name of the currently loaded parameter template.
Log Messages Enables output of informational messages to the NinjaTrader log. Useful for troubleshooting or verifying the indicator is loading templates and processing bars as expected.
Display Header Shows or hides the status text in the indicator's title bar. When enabled, the header displays the current Total Points score, the active Min Long and Min Short thresholds, and the template name.
Go Long Brush The color used to draw Go Long signal markers on the chart. Default: Forest Green.
Go Short Brush
The color used to draw Go Short signal markers on the chart. Default: Indian Red.
Min Long Pts
The minimum Total Points score required to generate a Go Long signal. Raise this value to filter out weaker long setups; lower it to see more. Must be >= 0. Default: 10.0.
Min Short Pts
The minimum Total Points score (absolute value) required to generate a Go Short signal. Raise this to filter short setups more aggressively. Must be >= 0. Default: 10.0.
Plot Type Controls what the indicator's sub-panel plots:
- Points — plots the raw Total Points score each bar. Useful for tuning thresholds and understanding scoring distribution.
- TradeSignal — plots +1 for a Long Signal, -1 for a Short Signal, or 0 for No Signal. Cleaner for use in strategies that consume the signal directly.
Show Edit Boxes Displays interactive edit controls on the chart that let you raise or lower the Min Long Pts and Min Short Pts thresholds in real time without reopening the indicator properties dialog.
MFE/MAE Section
Show PT/SL Lines Master switch for the MFE/MAE feature. When enabled, Cobra draws profit target (PT) and stop loss (SL) horizontal lines on the price panel after each new signal, based on historical excursion data from prior completed signals.
Horizon (bars) The number of bars after a signal to scan for the trade's Maximum Favorable Excursion and Maximum Adverse Excursion. Setting this too short may undercount how far the move eventually goes; setting it too long may include price action from entirely different setups. Default: 10.
Excursion Unit Determines whether MFE and MAE are measured in:
- Points — raw price points (ticks × tick size)
- Percent — percentage move from the entry price
Chart Line Source Controls which value is used to place the PT/SL lines on the chart:
- Last MFE/MAE — uses the most recent completed trade's raw excursion values
- Average MFE/MAE — uses a running average of all completed trades, smoothed by the Avg Type and Avg Period settings
Avg Type The averaging method applied when Chart Line Source is set to Average MFE/MAE:
- SMA — simple moving average over the last N completed trades
- EMA — exponential moving average, which weights more recent trades more heavily
Avg Period The number of completed trades to include in the rolling average. Only applies when Chart Line Source is Average MFE/MAE. Default: 10.
Min Sample Size The minimum number of completed trades that must exist before PT/SL average lines are drawn. Prevents the lines from appearing when there is insufficient historical data to produce a meaningful average. Default: 1.
Profit Target Color The color of the profit target (MFE) line drawn on the price panel. Default: Forest Green.
Stop Loss Color The color of the stop loss (MAE) line drawn on the price panel. Default: Indian Red.
Show % Lines When enabled, draws two additional reference lines at a configurable percentage of the full PT/SL distance from entry. Useful for scaling out at a partial target or setting a tighter initial stop.
Profit Line % The percentage of the entry-to-profit-target distance at which the reference profit line is drawn. For example, 80 draws the line at 80% of the full MFE distance. Set to 0 to hide. Default: 80.
Stop Line % The percentage of the entry-to-stop-loss distance at which the reference stop line is drawn. For example, 80 draws the line at 80% of the full MAE distance. Set to 0 to hide. Default: 80.
Profit % Line Color The color of the partial profit target reference line. Default: GreenYellow.
Stop % Line Color The color of the partial stop loss reference line. Default: Light Salmon.
Futures, foreign currency and options trading contains substantial risk and is not for every investor. An investor could potentially lose all or more than the initial investment. Risk capital is money that can be lost without jeopardizing ones financial security or lifestyle. Only risk capital should be used for trading and only those with sufficient risk capital should consider trading. Past performance is not necessarily indicative of future results.