Parameters Reference
Here is the Properties dialog that contains the Trade Analyzer parameters.
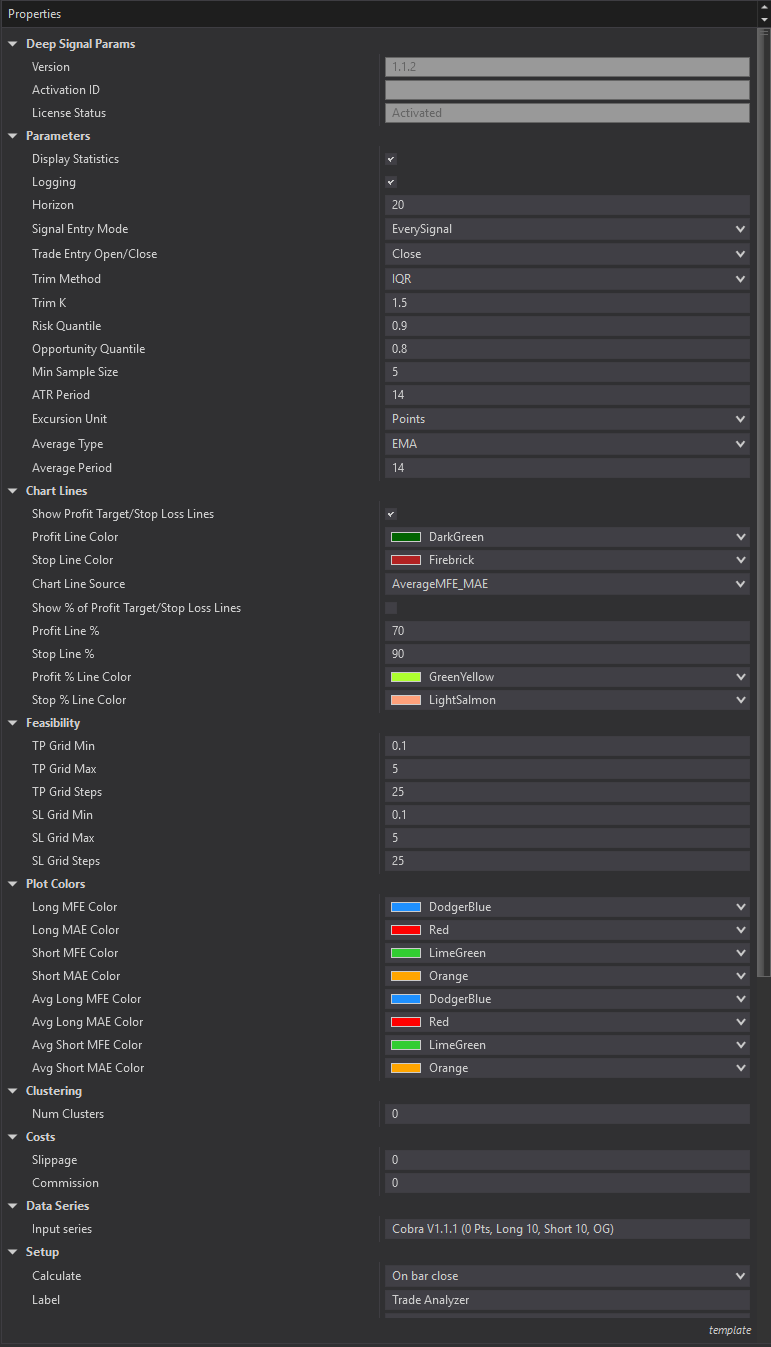
Chart Lines
Parameter |
Default |
Range |
Description |
|
Show Profit Target/Stop Loss Lines |
False |
True, False |
Draw profit target and stop loss lines on the price panel when a trade is entered |
|
Profit Line Color |
ForestGreen |
|
Color for the profit target line on the price panel |
|
Stop Line Color |
IndianRed |
|
Color for the stop loss line on the price panel |
|
Chart Line Source |
MFE/MAE |
MFE/MAE or Avg MFE/MAE |
Use last trade MFE/MAE or running average MFE/MAE to place chart lines |
|
Show % of Profit Target/Stop Loss Lines |
False |
True, False |
Draw lines based on percentage of max profit target and stop loss |
|
Profit Line % |
80% |
0-1000% |
Percentage of entry to profit-target distance for the profit reference line. Setting value to 0 will hide line. |
|
Stop Line % |
80% |
0-1000% |
Percentage of entry to stop-loss distance for the stop reference line. Setting value to 0 will hide line. |
|
Profit % Line Color |
GreenYellow |
|
Color for the profit percentage reference line |
|
Stop % Line Color |
LightSalmon |
|
Color for the stop percentage reference line |
Clustering
Parameter |
Default |
Range |
Description |
|
Num Clusters |
0 |
0-10 |
Number of trade clusters (0 = auto-detect) |
Cost Parameters
Parameter |
Default |
Range |
Description |
|
Slippage |
0.0 |
0-1.0 |
Slippage cost per trade (%) |
|
Commission |
0.0 |
0-1.0 |
Commission cost per trade (%) |
Feasibility Matrix (Take Profit/Stop Loss Grid)
Parameter |
Default |
Range |
Description |
|
TP (Take Profit) Grid Min |
0.1 |
0.01-10.0 |
Minimum take-profit value in grid |
|
TP Grid Max |
5.0 |
0.1-50.0 |
Maximum take-profit value in grid |
|
TP Grid Steps |
25 |
5-100 |
Number of TP grid points |
|
SL (Stop Loss) Grid Min |
0.1 |
0.01-10.0 |
Minimum stop-loss value in grid |
|
SL Grid Max |
5.0 |
0.1-50.0 |
Maximum stop-loss value in grid |
|
SL Grid Steps |
25 |
5-100 |
Number of SL grid points |
Plot Colors
Parameter |
Default |
Description |
|
Long MFE Color |
DodgerBlue |
Maximum favorable excursion for each long trade |
|
Long MAE Color |
Red |
Maximum adverse excursion for each long trade (negative values) |
|
Short MFE Color |
LimeGreen |
Maximum favorable excursion for each short trade |
|
Short MAE Color |
Orange |
Maximum adverse excursion for each short trade (negative values) |
|
Avg Long MFE Color |
DodgerBlue (dashed line) |
Moving average of Long MFE (dashed line) |
|
Avg Long MAE Color |
Red (dashed line) |
Moving average of Long MAE (dashed line) |
|
Avg Short MAE Color |
LimeGreen (dashed line) |
Moving average of Short MFE (dashed line) |
|
Avg Short MAE Color |
Orange (dashed line) |
Moving average of Short MAE (dashed line) |
General Parameters
Parameter |
Default |
Range |
Description |
|
Version |
|
Software Version |
|
|
Activation ID |
|
|
Activation ID for product |
|
License Status |
|
|
Current status of license (Activated, Not Activated) |
|
Display Statistics |
True |
|
Show summary statistics in the chart header |
|
Logging |
True |
|
Output detailed analysis to NinjaTrader's Output window |
|
Horizon |
10 |
1-100 |
Number of bars to look forward for MFE/MAE calculation |
|
Signal Entry Mode |
Direction Change |
EverySignal, DirectionChange, HorizonCooldown |
If using a selected indicator as Input, controls when repeated signals in the same direction create new trades. EverySignal = every +1/-1 bar enters. DirectionChange = only on signal direction change. HorizonCooldown = wait Horizon bars before re-entering same direction. |
|
ATR Period |
14 |
1-100 |
Period for ATR volatility measurement |
|
Min Sample Size |
5 |
1-100 |
Minimum trades required before analysis runs |
|
Excursion Unit |
Points |
Points, Percent |
Unit for displaying MFE/MAE values |
Outlier Trimming
Parameter |
Default |
Range |
Description |
|
Trim Method |
IQR |
None, IQR, Percentile |
Method to remove outliers from analysis None: No outlier removal IQR: Removes data outside Q1 - K*IQR and Q3 + K*IQR Percentile: Removes data below 1st percentile and above 99th percentile |
|
Trim K |
1.5 |
0.1-5.0 |
IQR multiplier for outlier boundaries |
Frontier Analysis
Parameter |
Default |
Range |
Description |
|
Risk Quantile |
0.9 |
0.5-0.99 |
Percentile for risk-constrained frontier analysis |
|
Opportunity Quantile |
0.8 |
0.5-0.99 |
Percentile for opportunity-constrained frontier analysis |
Moving Average Settings
Parameter |
Default |
Range |
Description |
|
Average Type |
EMA |
SMA, EMA |
Type of moving average for MFE/MAE smoothing |
|
Average Period |
14 |
1-500 |
Number of trades for average calculation |
Futures, foreign currency and options trading contains substantial risk and is not for every investor. An investor could potentially lose all or more than the initial investment. Risk capital is money that can be lost without jeopardizing ones financial security or lifestyle. Only risk capital should be used for trading and only those with sufficient risk capital should consider trading. Past performance is not necessarily indicative of future results.