Introduction
|
|
|
Deep Signal Trade Analyzer turns your historical trades into a clear statistical blueprint for smarter decision-making. It is a comprehensive MFE/MAE (Maximum Favorable Excursion / Maximum Adverse Excursion) trade geometry analysis indicator for NinjaTrader 8. It analyzes trading signal performance by measuring how far price moves in your favor (MFE) and against you (MAE) after trade entries. It finds optimal profit targets, and risk frontiers so you can see where your true edge lives. Instead of guessing entries and exits, you trade with data-driven confidence built from your own performance.
This tool helps you:
• Understand your trade behavior patterns
• Optimize take-profit and stop-loss levels
• Identify which trades are suitable for trailing stops vs. fixed targets
• Discover clusters of similar trade types in your data
• Display MAE/MFE on chart with instrument and in indicator window
|
|
|
Getting Started
Adding the Indicator to a Chart
1. Open a chart in NinjaTrader 8
2. Right-click on the chart and select Indicators
3. Find Deep Signal -> Indicators -> Trade Analyzer in the list
4. Configure the parameters (see Parameters Reference).
5. Unless using the indicator in a strategy we'll need to select an input source for the trade statistics. Please see the Signal Input section for more details.
6. Click OK to apply
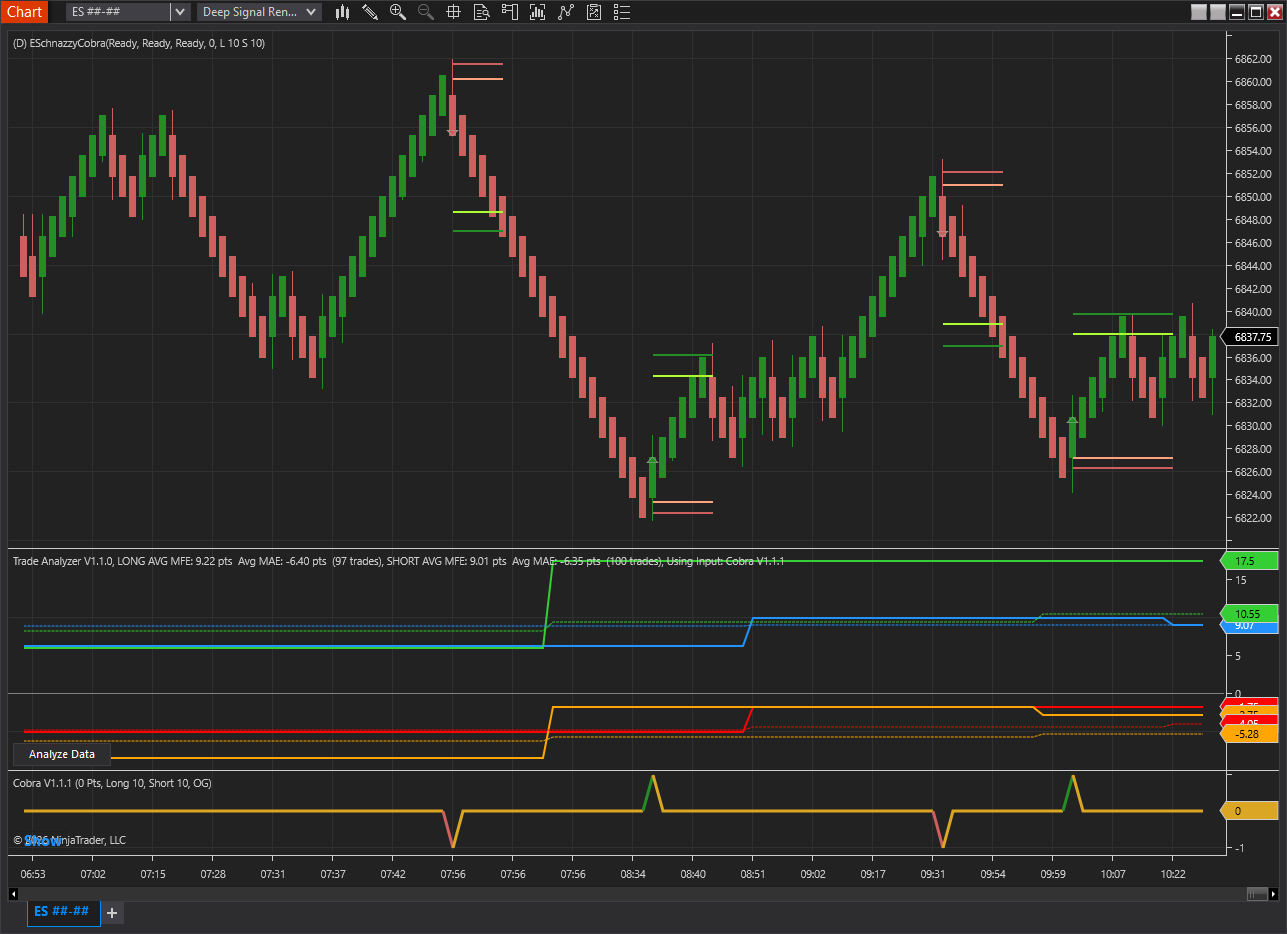
Understanding Trade Analyzer Plot Lines
The Trade Analyzer displays eight plot lines in a separate indicator panel below your price chart. These lines provide real-time feedback on your trade signal's MFE (Maximum Favorable Excursion) and MAE (Maximum Adverse Excursion) performance, allowing you to monitor and adjust your trading in real-time.
Unlike the analysis dialog plots that provide historical statistics, these indicator lines show you live, trade-by-trade data as it develops, making them essential for active trade management.
MFE/MAE Concepts
MFE (Maximum Favorable Excursion): The furthest price moved in your favor during the trade horizon (configurable parameter, in bars)
MAE (Maximum Adverse Excursion): The furthest price moved against you during the trade horizon (displayed as negative)
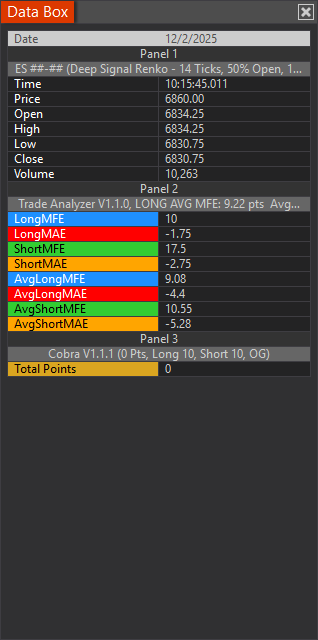
Plot Lines
Parameter |
Default |
Description |
|
Long MFE Color |
DodgerBlue |
Maximum favorable excursion for each long trade |
|
Long MAE Color |
Red |
Maximum adverse excursion for each long trade (negative values) |
|
Short MFE Color |
LimeGreen |
Maximum favorable excursion for each short trade |
|
Short MAE Color |
Orange |
Maximum adverse excursion for each short trade (negative values) |
|
Avg Long MFE Color |
DodgerBlue (dashed line) |
Moving average of Long MFE (dashed line) |
|
Avg Long MAE Color |
Red (dashed line) |
Moving average of Long MAE (dashed line) |
|
Avg Short MAE Color |
LimeGreen (dashed line) |
Moving average of Short MFE (dashed line) |
|
Avg Short MAE Color |
Orange (dashed line) |
Moving average of Short MAE (dashed line) |
Average Type Settings
The average lines can be calculated using two methods (configurable via the Average Type parameter):
SMA (Simple Moving Average):
• Equal weight to all trades in the lookback period
• Smoother, slower to react to changes
• Better for seeing long-term baseline performance
EMA (Exponential Moving Average): [Default]
• More weight to recent trades
• Faster reaction to changing conditions
• Better for detecting regime changes
The Average Period parameter (default: 14) controls how many trades are used in the calculation.
Understanding the Zero, MFE and MAE Lines
A gray horizontal line at zero serves as the critical reference point:
• MFE lines (blue/green) should be above zero - this represents profit potential
• MAE lines (red/orange) will be below zero - this represents drawdown (negative)
• The distance from zero shows the magnitude of the excursion
Signal Input
The Trade Analyzer needs trading signals to analyze. You can provide signals in two ways, either using input from another indicator or calling the EnterLong and EnterShort from within your custom strategy.
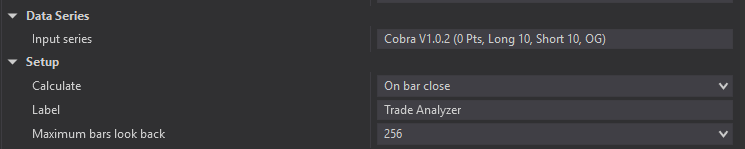
Use Input From Another Indicator
Pass an indicator that outputs +1 or greater for long signals and -1 or less for short signals as the input. In the Properties Dialog for Deep Signal Trade Analyzer, select the Input series in the Data Series section. Please see the Sample Trade Analyzer Input for more information on adding a customized indicator for input.
In the example below, Cobra has been chosen as an Input series.
A new Input series can be chosen by clicking on the Input series edit box in the Trade Analyzer Properties Dialog and selecting a new Input.
Programmatic Use
To use TradeAnalyzer in your custom strategy, add the TradeAnalyzer variable in your strategy
|
|
Adding TradeAnalyzer variable inside of strategy |
|
|
public class MyCustomStrategy : Strategy TradeAnalyzer _TradeAnalyzer = null;
|

In OnStateChange where State == State.Configure, call the constructor for TradeAnalyzer and the SetStrategy method.
|
|
Call TradeAnalyzer constructor and the SetStrategy method |
|
|
public class MyCustomStrategy : Strategy protected override void OnStateChange() { tradeAnalyzer = TradeAnalyzer( displayHeaderText: true, logging: true, horizon: 10, // ... other parameters ); tradeAnalyzer.SetStrategy(this); } |

Within your strategy's OnBarUpdate call EnterLong() or EnterShort() methods when the strategy enters a long or short trade. This will record the entry for the trade to compute the trade statistics.
|
|
Call EnterLong and EnterShort for TradeAnalyzer |
|
|
public class MyCustomStrategy : Strategy
{ // From your strategy logic: if (longCondition) tradeAnalyzer.EnterLong(); if (shortCondition) tradeAnalyzer.EnterShort(); } |
Here is a full code example.
|
|
Full code example |
|
|
public class MyCustomStrategy : Strategy // Add Trade Analyzer private TradeAnalyzer tradeAnalyzer = null;
// Update OnStateChange to initialize tradeAnalyzer protected override void OnStateChange() { tradeAnalyzer = TradeAnalyzer( displayHeaderText: true, logging: true, horizon: 10, // ... other parameters ); tradeAnalyzer.SetStrategy(this); }
{ // From your strategy logic, add in the longCondition and shortCondition to mark when entering trade if (longCondition) tradeAnalyzer.EnterLong(); if (shortCondition) tradeAnalyzer.EnterShort(); } |
Accessing Results Programmatically
Within your custom strategy, you can access raw trade data, geometry metrics and feasibility results. Here is an example.
|
|
Accessing Trade Analyzer geometry metrics, raw trade data or feasibility results |
|
|
public class MyCustomStrategy : Strategy // Add Trade Analyzer private TradeAnalyzer tradeAnalyzer = null;
// Update OnStateChange to initialize tradeAnalyzer protected override void OnStateChange() { tradeAnalyzer = TradeAnalyzer( displayHeaderText: true, logging: true, horizon: 10, // ... other parameters ); tradeAnalyzer.SetStrategy(this); }
{ // Get geometry metrics GeometryMetrics longMetrics = tradeAnalyzer.LongGeometryMetrics; GeometryMetrics shortMetrics = tradeAnalyzer.ShortGeometryMetrics; // Get feasibility results FeasibilityResult longFeas = tradeAnalyzer.LongFeasibility; FeasibilityResult shortFeas = tradeAnalyzer.ShortFeasibility; // Access raw trade data List<TradeGeometry> longTrades = tradeAnalyzer.LongTrades; List<TradeGeometry> shortTrades = tradeAnalyzer.ShortTrades; // Access series data double currentLongMFE = tradeAnalyzer.LongMFE[0]; double currentLongMAE = tradeAnalyzer.LongMAE[0]; double avgLongMFE = tradeAnalyzer.AvgLongMFE[0]; // From your strategy logic, add in the longCondition and shortCondition to mark when entering trade if (longCondition) tradeAnalyzer.EnterLong(); if (shortCondition) tradeAnalyzer.EnterShort(); } |
Chart Line Parameters (Profit Target, Stop Loss & % Lines)
These settings control how Trade Analyzer visualizes your statistically derived profit targets and stop levels directly on the price chart.
Enable “Show Profit Target/Stop Loss Lines” to draw the primary target and stop lines when a trade is entered. These levels are calculated using either the most recent trade’s MFE/MAE or the running average, depending on the selected Chart Line Source. You can customize the appearance using the Profit and Stop line colors.
Enable “Show % of Profit Target/Stop Loss Lines” to add secondary reference lines based on a percentage of the full target and stop distance. The Profit Line % and Stop Line % define how far these lines are from the entry relative to the full target/stop (e.g., 80% shows a line at 80% of the distance). Setting either percentage to 0 hides that line. Colors for these reference lines can be customized independently.
Together, these lines help you visualize both full target/stop levels and intermediate zones for scaling out, tightening risk, or managing trades more precisely.
Analyze Data Button
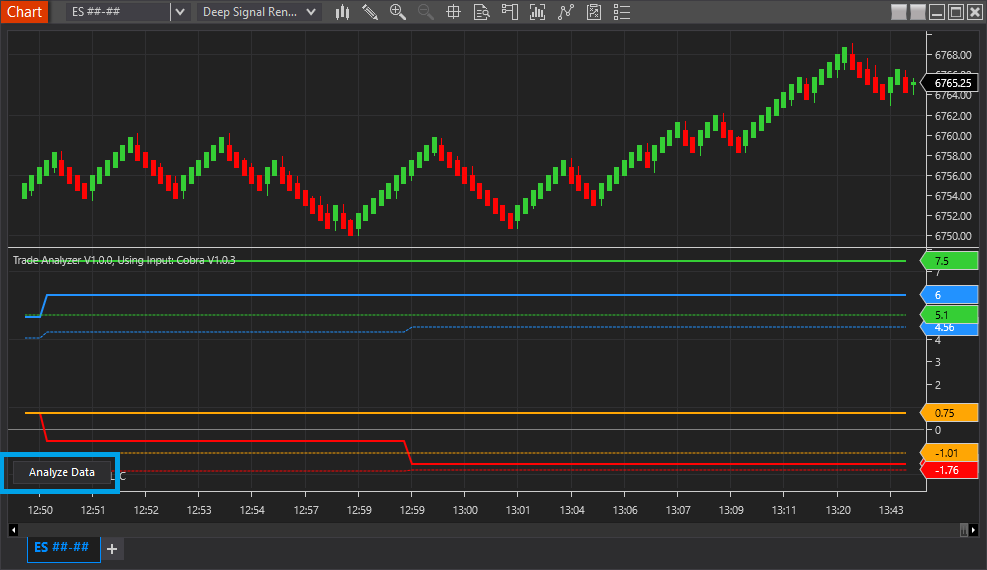
An Analyze Data button appears at the bottom-left of the chart. Clicking it opens a detailed analysis dialog with interactive visualizations. Please see the Analysis Plots for more information about the plot types.
Available Plot Types
- Scatter Plot: MFE vs MAE distribution for all trades
- Marginals Plot: Histograms of MFE and MAE distributions
- Heatmap Probability: TP/SL probability matrix showing P(TP hit before SL)
- Heatmap EV: Expected value matrix for different TP/SL combinations
- Frontiers Plot: Risk-constrained and opportunity-constrained frontier curves
- Cluster Scatter: Trade clusters visualized on MFE/MAE axes
- Cluster Statistics: Summary statistics for each cluster
- Ordering Scatter: Trades colored by whether MFE or MAE was hit first
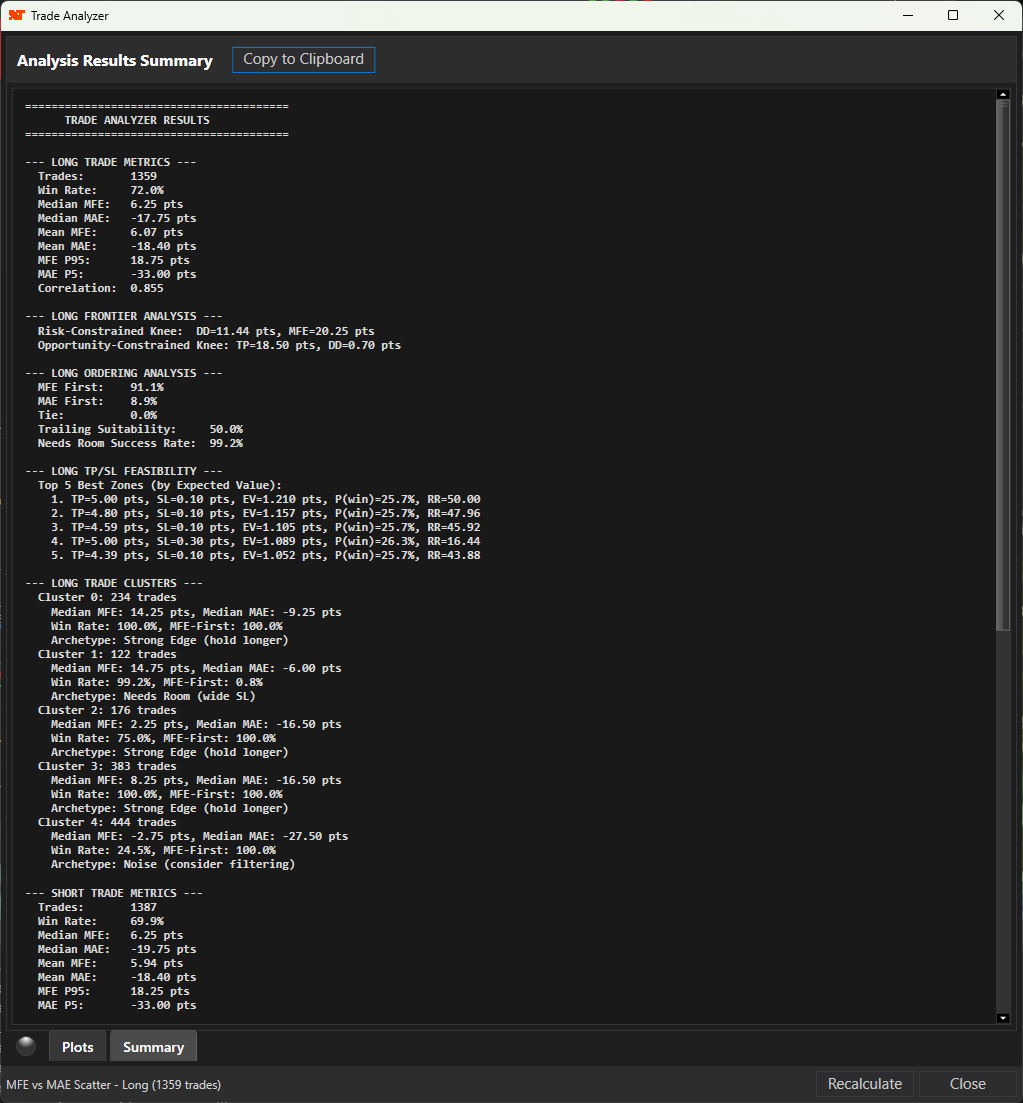
Output Window Logging
When Logging is enabled, a full analysis report is printed to the NinjaTrader Output window at the end of loading the historical data.
This includes:
- Trade Metrics for Long and Short sides
- Frontier Analysis knee points
- Ordering Analysis rates
- Top 5 TP/SL feasibility zones
- Cluster summaries with archetypes
Here is an example of the Summary window using Cobra as an Input. Please see the Summary Page for more details.
Tips for Best Results
- Sufficient Data: Ensure you have enough trades (at least MinSampleSize, ideally 30+) for meaningful analysis
- Appropriate Horizon: Set the horizon to match your typical trade holding period
- Unit Selection: Use "Points" for consistent interpretation across instruments, or "Percent" for comparing across different price levels
- Outlier Handling: Start with IQR trimming (K=1.5) to remove extreme outliers that can skew statistics
- Feasibility Grid: Adjust TP/SL grid ranges based on your instrument's typical movement
- Clustering: Let the auto-detect (NumClusters=0) handle cluster count initially, then refine if needed
- Costs Matter: Include realistic slippage and commission estimates for accurate EV calculations
Troubleshooting
Issue |
Solution |
|
Not enough trade data |
Ensure your signal source is generating trades; increase data range |
|
No plots showing |
Check that signals are being generated (+1 or greater for Long, -1 or less for Short) |
|
Analysis button missing |
Only appears after historical data processing completes |
|
Metrics all zero |
Verify Horizon setting allows enough forward bars for calculation |
Futures, foreign currency and options trading contains substantial risk and is not for every investor. An investor could potentially lose all or more than the initial investment. Risk capital is money that can be lost without jeopardizing ones financial security or lifestyle. Only risk capital should be used for trading and only those with sufficient risk capital should consider trading. Past performance is not necessarily indicative of future results.