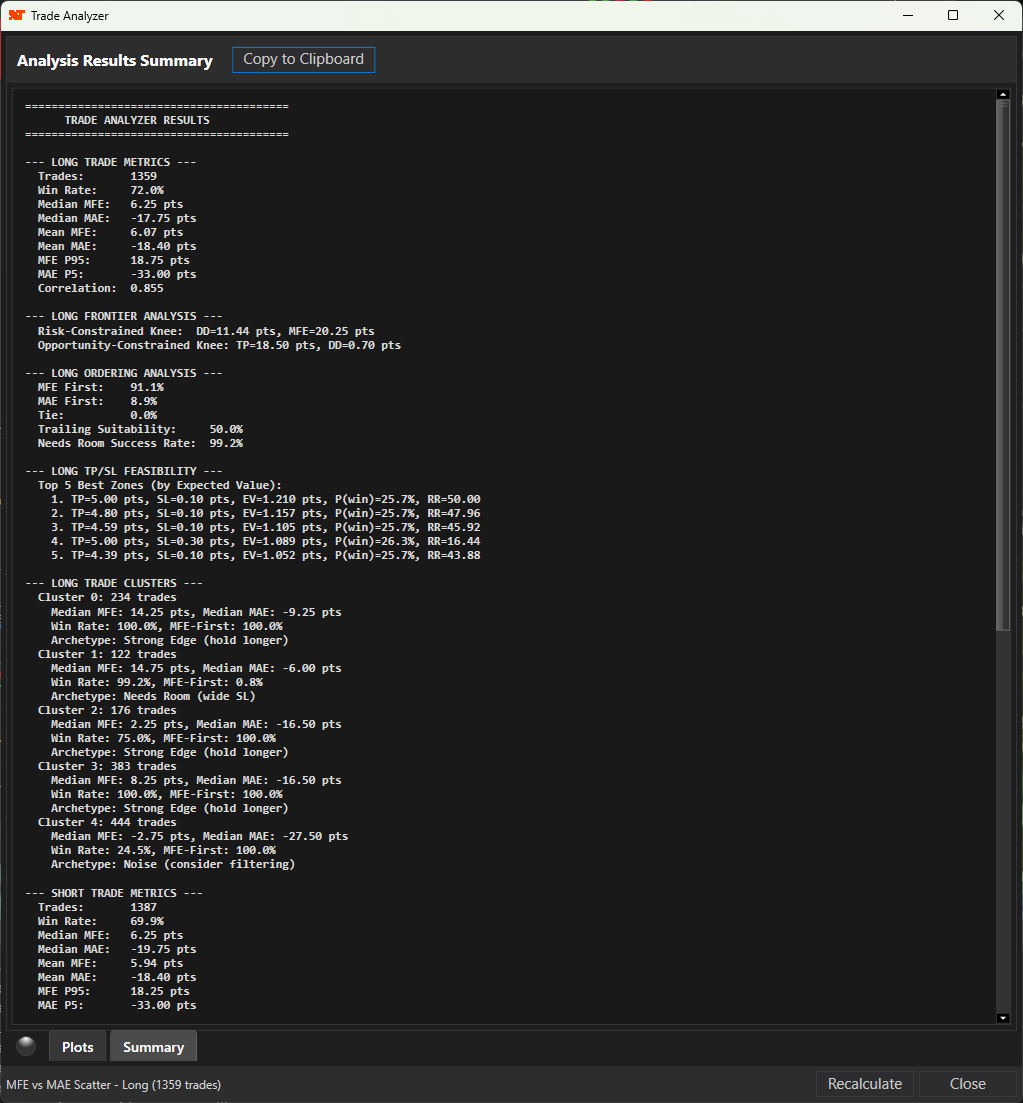
Summary Page
The Summary Page in the Analysis dialog contains the summarized results of the trade analysis. Just click on the Analysis button in the indicator and select the Summary tab. If logging is enabled, the trade analysis will also be shown in the NinjaTrader Output Window after all historical bars have been loaded. It can be recalculated when running Live Data by clicking on the Recalculate button.
When the Trade Analyzer completes its analysis (at the end of historical data or clicking on the Recalculate button), it prints a comprehensive report. This report contains five sections for each trade direction (Long and Short):
1. Trade Metrics - Core statistical measures of trade performance
2. Frontier Analysis - Optimal balance points for risk and reward
3. Ordering Analysis - Whether trades profit or suffer first
4. TP/SL Feasibility - Best take-profit and stop-loss combinations
5. Trade Clusters - Groups of similar trade behaviors
Each section helps you understand how your strategy behaves and how to improve trade management.
Section 1 – Trade Metrics
This section describes the statistical foundation of your trade behavior. These metrics determine whether your system has a measurable edge.
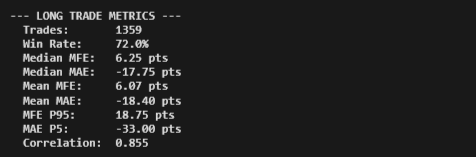
Trades
Definition
Total number of completed trades analyzed.
Purpose
Sample size determines reliability of all results.
Guidelines
- Under 20 trades: Results are preliminary
- 20–50 trades: Moderate reliability
- 50–100 trades: Good reliability
- Over 100 trades: Statistically meaningful
Do not optimize a strategy based on small samples.
Win Rate
Definition
Percentage of trades where price moved favorably at any point. This measures directional accuracy, not realized profit.
Interpretation
- Above 60%: Strong directional edge
- 50–60%: Moderate edge
- 40–50%: Weak edge
- Below 40%: Signal may be counter-predictive
Win rate must be evaluated together with MFE/MAE ratios.
Median MFE
Definition
Typical favorable excursion. Half of trades exceed this value.
Usage
- Realistic take-profit reference
- Defines achievable target range
Suggested targets:
Conservative target = Median MFE × 0.8
Balanced target = Median MFE
Aggressive target = Median MFE × 1.2
Targets above Median MFE will miss frequently.
Median MAE
Definition
Typical adverse excursion (expected drawdown).
Usage
- Defines normal drawdown
- Stop-loss survival reference
Minimum stop = absolute Median MAE
Safe stop = absolute Median MAE × 1.3
Wide stop = absolute Median MAE × 1.5
Stops tighter than Median MAE will fail on most trades.
Mean MFE
Definition
Average favorable excursion including outliers.
Interpretation
- Mean > Median: occasional large winners
- Mean much greater than Median: strong positive skew
- Mean < Median: outlier losses pulling average down
If Mean MFE is significantly larger than Median MFE, trailing stops may capture additional edge.
Mean MAE
Definition
Average adverse excursion including extreme drawdowns. Large differences from Median MAE indicate fat-tail risk.
Risk management must account for rare but severe losses.
MFE P95
Definition
95th percentile favorable excursion.
Represents the upper boundary of realistic performance. Targets above this level are rarely hit.
MAE P5
Definition
5th percentile adverse excursion.
Represents worst realistic drawdown. Used for capital protection and position sizing.
Correlation
Definition
Relationship between profit and drawdown. Range: -1 to +1.
- Positive correlation: winners had small drawdown
- Negative correlation: winners required pain first
- Near zero: no relationship
Strong negative correlation means trades need room to work.
Section 2 – Frontier Analysis
Identifies mathematically optimal balance between risk and opportunity.
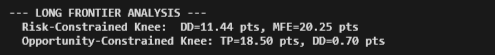
Risk-Constrained Knee
Shows the maximum MFE you can expect at different drawdown (MAE) limits. The "knee point" suggests an optimal balance.
Output includes:
DD = optimal drawdown tolerance
MFE = expected favorable excursion
This value serves as a baseline stop reference.
Opportunity-Constrained Knee
Shows the minimum drawdown needed to achieve different take-profit targets. Helps size stops appropriately.
TP = optimal target
DD = required drawdown tolerance
Targets above this level require disproportionately more risk.
Section 3 – Ordering Analysis
Reveals whether profit or drawdown occurs first. This determines management style.
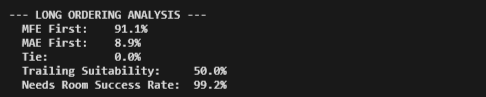
MFE First
Trades move in your favor before drawdown. High values favor trailing stops.
MAE First
Trades move against you before recovering. High values require wider stops and patience.
Tie
MFE and MAE occur simultaneously. High tie percentage suggests volatile entry timing.
Trailing Suitability
Filtered measure of trailing stop viability.
- Above 60%: strong trailing candidate
- 50–60%: moderate
- Below 50%: fixed TP/SL preferred
Needs Room Success Rate
Measures whether MAE-first trades recover meaningfully.
High values justify patience. Low values favor quicker exits.
Section 4 – TP/SL Feasibility
Ranks Take Profit/Stop Loss combinations by Expected Value. Zones are sorted from best to worst.
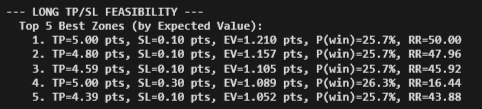
Expected Value (EV)
EV = Probability(win) × TP − Probability(loss) × SL − costs
- EV greater than zero: profitable
- EV equal to zero: break-even
- EV below zero: losing
Higher EV equals better long-term performance.
Probability of Win
Frequency that TP hits before SL. Higher values produce more frequent wins but may reduce target size.
Risk/Reward Ratio
Risk/Reward = TP divided by SL
Break-even win rate = 1 / (1 + Risk/Reward)
Probability of win must exceed break-even threshold.
Section 5 – Trade Clusters
Groups trades by behavioral similarity. Each cluster represents a trade archetype.
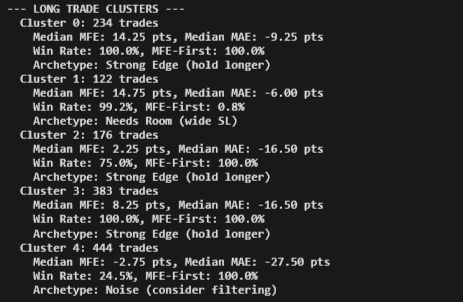
Cluster Count
Number of trades in the cluster. Large clusters dominate performance.
Cluster Median MFE and MAE
Typical behavior of that trade group. Different clusters may require different management.
Cluster Win Rate
Identifies strong vs weak trade conditions. Useful for filtering signals.
Cluster MFE-First Percentage
Determines management style per cluster. High values favor trailing stops.
Cluster Archetypes
Fast Winner
Quick profit with minimal drawdown. Trailing stops recommended.
Needs Room
Trades recover after drawdown. Wide fixed stops required.
Noise
Weak trade behavior. Consider filtering.
Strong Edge
Excellent trade quality. Hold longer and size appropriately.
Mixed
No consistent behavior. Context dependent.
Putting It All Together
Recommended workflow:
- Verify sufficient sample size
- Confirm statistical edge
- Set stop-loss from risk knee
- Set take-profit from opportunity knee
- Choose management style from ordering analysis
- Filter weak clusters
- Re-run analysis periodically
Futures, foreign currency and options trading contains substantial risk and is not for every investor. An investor could potentially lose all or more than the initial investment. Risk capital is money that can be lost without jeopardizing ones financial security or lifestyle. Only risk capital should be used for trading and only those with sufficient risk capital should consider trading. Past performance is not necessarily indicative of future results.