Risk/Opportunity Frontiers
What It Shows
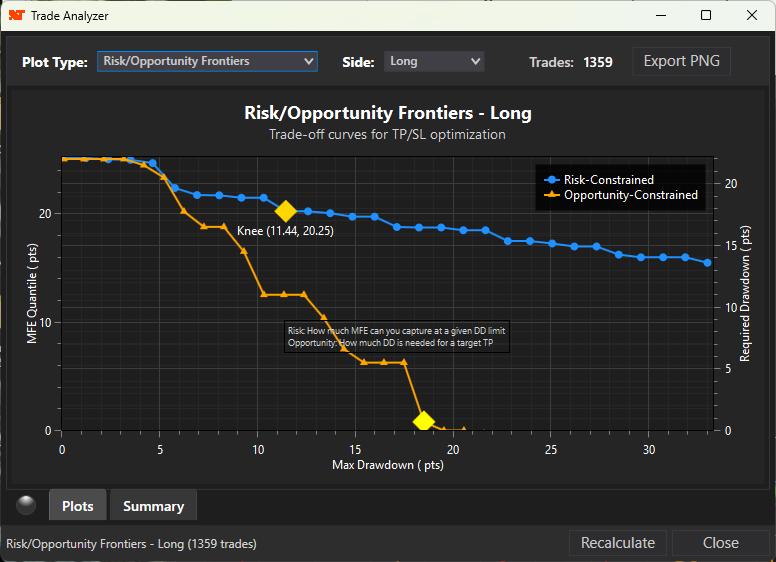
Two curves that answer fundamental trade-off questions:
Risk-Constrained Frontier (Blue):
"If I limit my maximum drawdown to X, what's the best MFE I can expect?"
• X-axis: Maximum allowed drawdown
• Y-axis: Expected MFE at that drawdown limit
Opportunity-Constrained Frontier (Orange):
"If I want to achieve profit target X, what drawdown do I need to accept?"
• X-axis: Target take-profit
• Y-axis: Required drawdown tolerance
Knee Points (Gold diamonds):
The optimal balance point on each curve where the trade-off shifts dramatically.
How to Read It
Curve Shape:
• Steep initial rise: Small increases in drawdown tolerance yield large MFE gains
• Flat region: Additional drawdown tolerance provides diminishing returns
• Knee point: Where the curve bends - optimal efficiency
Frontier Comparison:
• Higher blue curve: Better risk/reward - get more MFE per unit of drawdown
• Lower orange curve: Targets are achievable with less pain
How to Use This to Improve Trading
1. Find Your Optimal Stop Distance:
The knee point on the blue (risk) curve tells you the ideal stop-loss distance. Before this point, tighter stops significantly reduce profits. After this point, wider stops provide diminishing benefits.
Example: If the knee is at DD=1.5 points, MFE=2.8 points:
• Stops tighter than 1.5 pts sacrifice too much profit
• Stops wider than 1.5 pts don't improve profits much
• 1.5 points is your optimal stop distance
2. Set Realistic Profit Targets:
The orange (opportunity) curve shows what drawdown you must accept for any target. If you want 4-point profits but the curve shows this requires 3-point drawdowns, ask yourself if you can handle that pain.
3. Understand Your Signal's Nature:
• Steep curve then flat: Signal has a sweet spot - use it
• Linear curve: Proportional relationship - no special advantage at any level
• Concave curve: Diminishing returns throughout - keep targets modest
4. Compare Long vs Short:
Different frontier shapes for longs vs shorts indicate asymmetric behavior. One direction may have better risk/reward characteristics.
Futures, foreign currency and options trading contains substantial risk and is not for every investor. An investor could potentially lose all or more than the initial investment. Risk capital is money that can be lost without jeopardizing ones financial security or lifestyle. Only risk capital should be used for trading and only those with sufficient risk capital should consider trading. Past performance is not necessarily indicative of future results.